


Every market cycle has one question that dominates investor conversations. Today, that question is simple. Is the market expensive?
With the Nifty trading at nearly 22 times earnings (FY26), opinions are sharply divided. Some investors see stretched valuations and believe the prudent course is to wait. Others view the same market as the beginning of the next leg of India’s structural growth story. Surprisingly, both camps are looking at the same number. The appeal of the P/E ratio is obvious. It reduces an entire market into one simple metric. One number. One market. One answer.
Unfortunately, investing rarely works that way. At AAA, we believe successful investing rarely begins by asking whether the market is cheap or expensive. It begins with understanding what expectations are already embedded in current prices and whether those expectations are likely to prove right or wrong.
That distinction changes everything.
But that raises an obvious question. If the market is merely an aggregation of hundreds of businesses, each with different economics, growth prospects and risks, can a single valuation multiple really tell us whether the market is expensive?
The answer is no.
The Nifty is not the valuation of one business. It is the weighted average valuation of companies with vastly different business models, growth trajectories and risk profiles. Reducing all that complexity into a single valuation multiple may be convenient, but convenience and accuracy are rarely the same thing.
This becomes evident when we look beneath the index. P/E is not merely a measure of cheapness. More often, it is a reflection of business quality. Companies with predictable earnings, pricing power, high returns on capital and long growth runways such as consumer and healthcare businesses naturally command premium valuations (Refer to Table 1). Cyclical sectors like metals and oil & gas, where earnings fluctuate with commodity prices, typically trade at much lower multiples because future earnings are inherently less predictable.
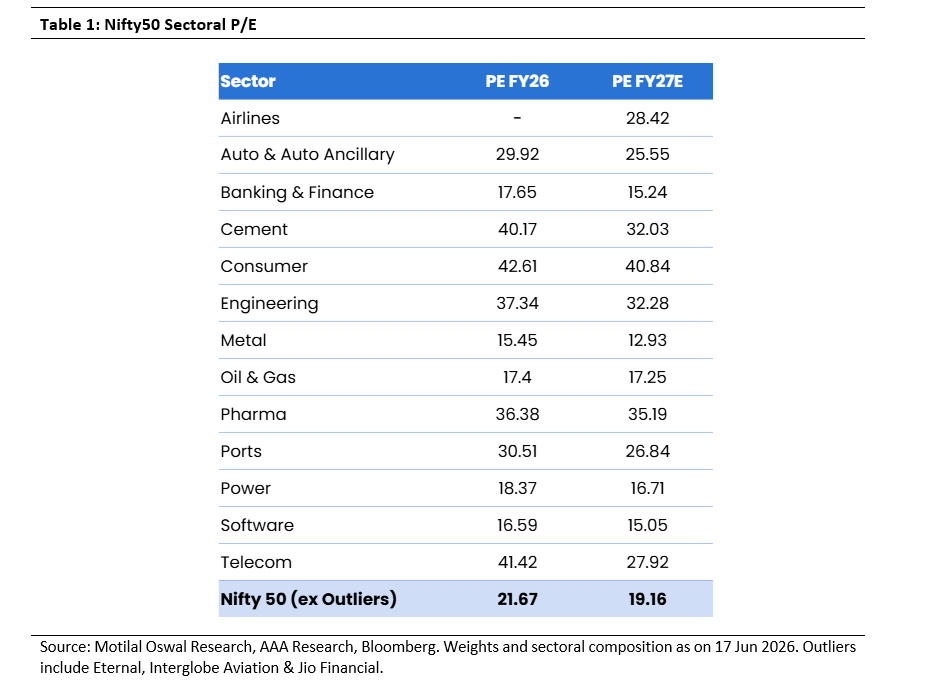
Different sectors naturally deserve different valuation multiples because their business quality, earnings visibility and risk profiles are fundamentally different. But that only answers why sectors trade at different P/Es. It does not tell us whether those valuations are justified.
To answer that question, we need to go one layer deeper.
Consider two sectors that, at first glance, appear expensive. Consumer companies trade at roughly 43 times FY26 earnings, while engineering and capital goods companies trade at around 37 times FY26 earnings. For many investors, both would immediately fall into the same bucket. End of discussion.
Yet their recent experiences could not have been more different (Refer to Fig 1).
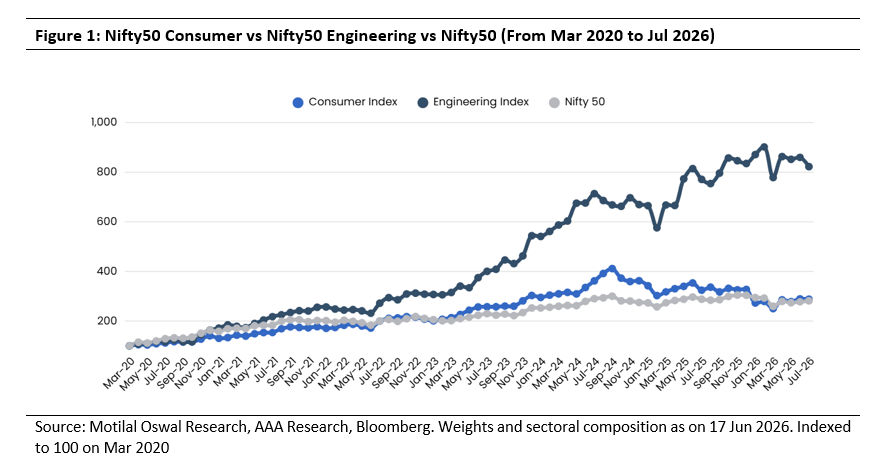
Consumer companies earned their premium valuations over decades. They were viewed as dependable compounders capable of delivering consistent earnings growth regardless of economic conditions. Investors were willing to pay increasingly higher multiples for predictability, stability and resilience. Engineering companies, by contrast, rerated because investors began anticipating a structural investment cycle. Rising power demand, electrification, transmission infrastructure, manufacturing expansion and energy transition investments all pointed towards a sustained period of capital expenditure. Investors were not paying for certainty. They were paying for future growth. The distinction may appear subtle, but it has produced dramatically different outcomes. Despite carrying seemingly demanding valuations, many engineering and capital goods companies have delivered exceptional shareholder returns over the past few years. Their order books expanded, earnings accelerated and cash flows improved. The growth investors anticipated actually materialised. Consumer companies, meanwhile, faced a different reality. Growth slowed, volume expansion weakened and earnings failed to keep pace with the expectations embedded in their valuations. As a result, many stocks spent years moving sideways despite continuing to trade at premium multiples.
This is where the traditional valuation debate begins to break down. If stocks trading at similarly rich valuations can produce vastly different outcomes, then the valuation multiple itself cannot be the primary determinant of returns. Perhaps investors have been asking the wrong question all along. This is precisely why, at AAA, we never evaluate valuation in isolation. Every investment decision begins with three questions:
- Is the quality of the business improving?
- Is earnings growth accelerating or decelerating?
- Has the market already priced in that change?
The best investment opportunities rarely emerge simply because valuations are low. They emerge when business fundamentals improve faster than market expectations. That is where valuation, growth and business quality converge.
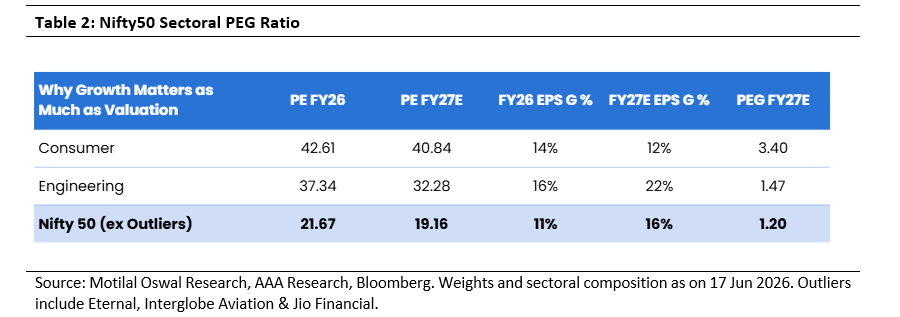
Instead of asking whether a stock trades at 20 times earnings or 40 times earnings, the more relevant question is whether its future earnings potential justifies the valuation being paid. This is where growth adjusted valuation metrics such as PEG become useful. While no single valuation metric is perfect, PEG forces investors to evaluate price in the context of expected earnings growth rather than in isolation. Viewed through this lens, sectors that appear similarly expensive can look fundamentally different. Engineering companies trade at around 37 times earnings while expected earnings are growing at over 20% (FY27E). Consumer companies trade at roughly 43 times earnings but are expected to deliver significantly lower earnings growth (FY27E). The difference in valuation is modest. The difference in expected growth is substantial. When viewed through the lens of PEG, the two sectors represent very different investment propositions (Refer to Table 2).
The same principle becomes even clearer at the individual company level.
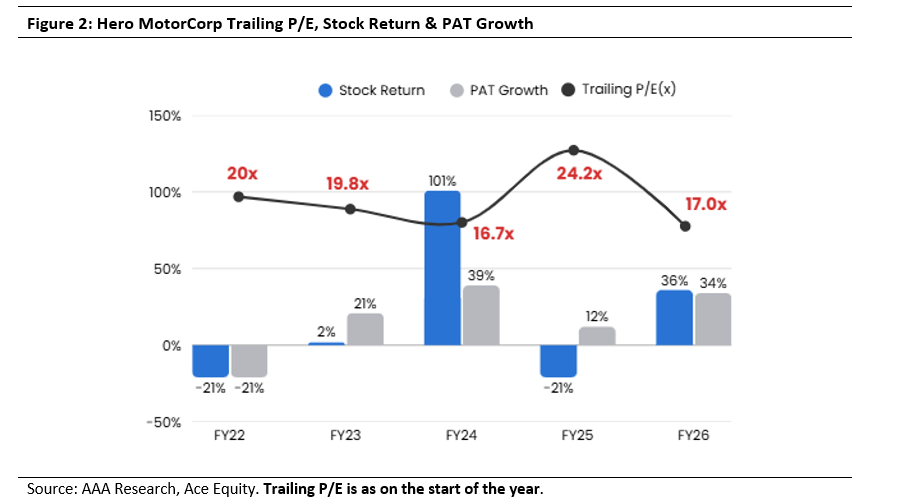
Consider Hero MotorCorp. At the start of FY24, the stock had derated to just 16.7x trailing earnings after two years of subdued earnings growth (Refer to Fig 2). Many growth investors would have looked elsewhere, preferring businesses already exhibiting strong momentum. Yet as the business turned the corner, PAT grew 39% over FY24 and the stock returned 101%. The opportunity was never the low valuation. It was the inflection in earnings that the market had yet to recognise. Investors were anchored to the past, while the business was already moving towards a different future.
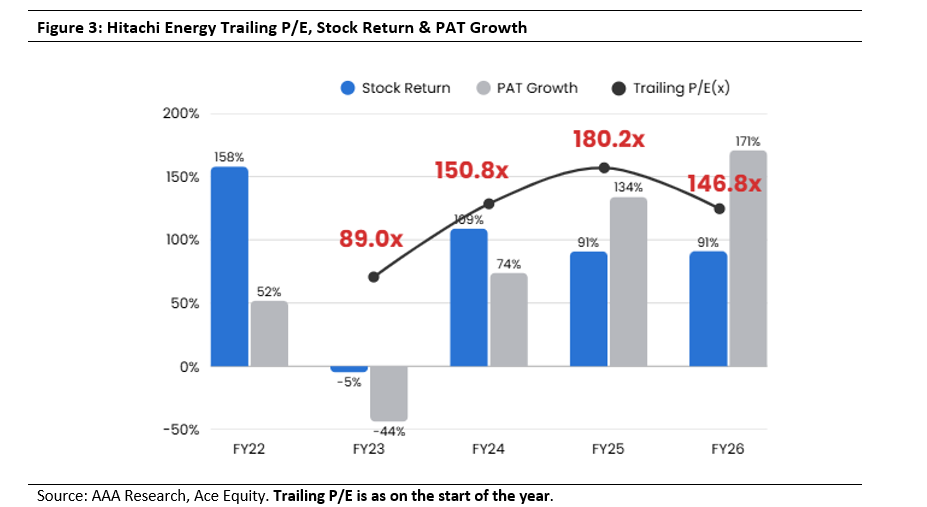
Hitachi Energy tells the opposite story. At the start of FY23, the stock traded at 89x trailing earnings (Refer to Fig 3). Most investors stopped there. The valuation looked impossible to justify. Few paused to ask a far more important question: What if today’s earnings were merely a fraction of what the business could be earning three years from now? Over the next three years, PAT grew 74%, 134% and 171%, while the stock delivered annual returns of 109%, 91% and 91%. The valuation multiple was never the story. The real story was the extraordinary expansion in the company’s earnings base. What appeared to be an outrageous valuation was simply tomorrow’s business hiding behind today’s earnings.
At first glance, Hero MotoCorp and Hitachi Energy appear to represent opposite investment styles. One looked optically cheap, while the other appeared prohibitively expensive. Yet both generated exceptional shareholder returns for the same fundamental reason: the market underestimated the trajectory of future earnings.
Taken together, these examples expose the blind spots at both ends of the investing spectrum. A value investor would have rejected Hitachi because the valuation looked absurd. A growth investor would likely have overlooked Hero because the growth wasn’t yet visible. Each conclusion would have been perfectly logical within its own framework.
Yet both would have missed the investment opportunity because they focused on today’s valuation or today’s growth rather than tomorrow’s earnings trajectory.
Perhaps this is where investing becomes less about choosing between value and growth, and more about recognising when the two converge. The biggest winners rarely begin as the cheapest stocks. Equally, they rarely begin as the fastest growing ones. They begin as businesses where tomorrow’s growth is still being valued using yesterday’s earnings. This is precisely where our QuAgility investment philosophy comes into play. We do not choose between value and growth. We seek high quality businesses where improving fundamentals are not yet fully reflected in market expectations. We believe sustainable wealth creation occurs at the intersection of three factors: high quality businesses, improving earnings trajectories and valuations that remain reasonable relative to future growth.
Business quality determines sustainability. Earnings growth creates intrinsic value. Valuation determines the return an investor ultimately earns. This is the essence of Growth at a Reasonable Price (GARP) which sits at the foundation of our investment philosophy. It is not a compromise between value and growth; it is the recognition that both are inseparable. Great businesses can become poor investments if expectations are too optimistic, while modest valuations can create exceptional returns when future earnings surprise positively.
Yet even GARP is only part of the puzzle. By the time a business screens attractively on consensus forecasts or becomes everyone’s favourite GARP stock, much of the rerating has often already taken place. Markets reward investors for recognising change before it becomes consensus not for recognising consensus itself.
Ultimately, successful investing is not about predicting where the market’s P/E will trade next quarter. It is about recognising when the market’s expectations are wrong.
At AAA, we rarely begin by asking whether a company is cheap or expensive. We begin by asking a more important question: Has the market correctly understood how this business is about to change? Sometimes the answer leads us to avoid businesses that appear inexpensive but face deteriorating fundamentals. At other times, it leads us to invest in businesses that appear optically expensive because tomorrow’s earnings are still being valued using yesterday’s numbers.
The Nifty’s P/E, therefore, is not an answer. It is merely the first clue. The real opportunity lies in understanding the expectations hidden beneath that single number.
Quarterly Snapshot – Q4FY26
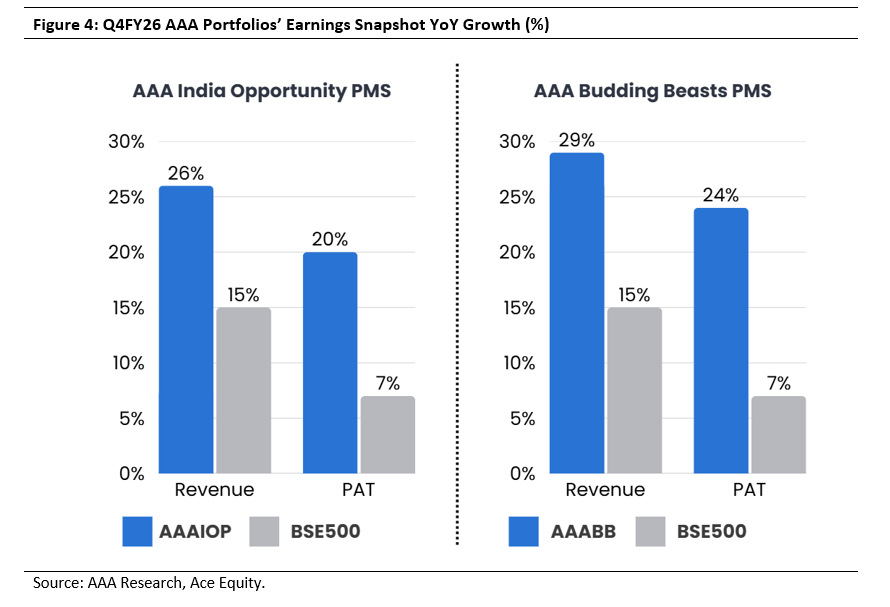
During 4QFY26, the BSE500 delivered muted single earnings growth due to geopolitical headwinds (Refer to Fig 4). Against this backdrop, all AAA portfolios once again stood out by reporting robust revenue growth and strong profit expansion, reaffirming the strength of our disciplined stock selection strategy. AAA India Opportunity PMS delivered an impressive 26% revenue growth and 20% net profit growth, while AAA Budding Beasts PMS reported 29% revenue growth and 24% profit growth. This consistent outperformance reflects our unwavering focus on quality, growth, and valuation discipline. Our ability to identify structural winners early, businesses with resilient earnings profiles, strong execution, and durable competitive advantages, has helped cushion the impact of sectoral slowdowns and enabled us to generate meaningful alpha across market cycles.
DISCLAIMER: This document is not for public distribution and has been furnished to you solely for your information and may not be reproduced or redistributed to any other person. The manner of circulation and distribution of this document may be restricted by law or regulation in certain countries, including the United States. Persons into whose possession this document may come are required to inform themselves of, and to observe, such restrictions. This material is for the personal information of the authorized recipient, and we are not soliciting any action based upon it. This report is not to be construed as an offer to sell or the solicitation of an offer to buy any security in any jurisdiction where such an offer or solicitation would be illegal. No person associated with AlfAccurate Advisors Pvt Ltd is obligated to call or initiate contact with you for the purposes of elaborating or following up on the information contained in this document. The material is based upon information that we consider reliable, but we do not represent that it is accurate or complete, and it should not be relied upon. Neither AlfAccurate Advisors Pvt Ltd., nor any person connected with it, accepts any liability arising from the use of this document. The recipient of this material should rely on their own investigations and take their own professional advice. Opinions expressed are our current opinions as of the date appearing on this material only. While we endeavour to update on a reasonable basis the information discussed in this material, there may be regulatory, compliance, or other reasons that prevent us from doing so. Prospective investors and others are cautioned that any forward-looking statements are not predictions and may be subject to change without notice. We and our affiliates, officers, directors, and employees worldwide, including persons involved in the preparation or issuance of this material may; (a) from time to time, have long or short positions in, and buy or sell the securities thereof, of company (is) mentioned herein or (b) be engaged in any other transaction involving such securities and earn brokerage or other compensation or act as a market maker in the financial instruments of the company (is) discussed herein or may perform or seek to perform investment banking services for such company(is)or act as advisor or lender / borrower to such company(is) or have other potential conflict of interest with respect to any recommendation and related information and opinions. The same persons may have acted upon the information contained here. No part of this material may be duplicated in any form and/or redistributed without AlfAccurate Advisors Pvt Ltd.’s prior written consent. No part of this document may be distributed in Canada or used by private customers in the United Kingdom. In so far as this report includes current or historical information, it is believed to be reliable, although its accuracy and completeness cannot be guaranteed.
AlfAccurate Advisors Private Limited is registered with SEBI as a Portfolio Manager having SEBI registration number – INP000003419 and as an Investment Advisor having SEBI registration number – INA000015701. AAA India Equity Fund – Scheme 1 and AAA GEMS Fund are open-ended schemes of AAA India Equity Fund, a Category III Alternative Investment Fund having SEBI registration number – IN/AIF3/22-23/1226 managed by AlfAccurate Advisors LLP (collectively referred as “AAA”).