Mid and small caps have long carried a reputation for risk: sudden plunges that wipe out value in days, sharp drawdowns that can shake even the most confident investors, and wild swings that seem to defy logic and market fundamentals. Headlines amplify every move, anecdotes dwell on spectacular failures, and cautionary tales are endlessly repeated, all combining to paint a picture of a market segment fraught with danger, uncertainty, and unpredictability.
Yet behind this fear lies a paradox. While volatility dominates headlines, it only tells part of the story. Within this segment coexist two very different worlds. Some businesses struggle to survive, while others are high-quality, long-term compounders capable of delivering extraordinary returns. This coexistence creates a spectrum of outcomes that conventional wisdom often overlooks, leaving many investors wary and missing opportunities. To replace fear-driven narratives with facts, we examined the mid and small cap universe over the past decade, from FY15 to FY25.
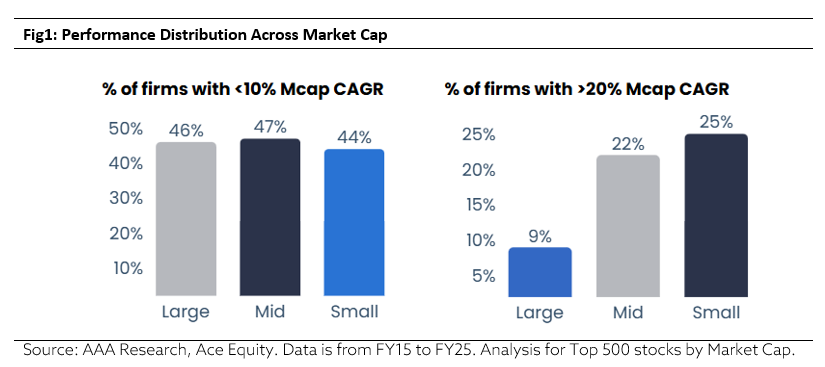
Downside Return Distribution
There is a perception that large caps are safer compared with mid and small caps. To test this, we conducted a 10 year market cap returns analysis. To our surprise, across market capitalisations, a substantial share of companies struggled to deliver meaningful long term returns. Nearly half of companies across large, mid, and small caps delivered annualized returns below 10% over the period studied, with 46% of large caps, 47% of mid caps, and 44% of small caps falling into this category (Refer to Fig1). The similar failure rates across market capitalisations show that subpar long term returns are not size specific, effectively busting the myth that large caps are inherently safe.
Long-Term Wealth Creation Distribution
However, the same story is not seen on the upside. To test this, we examined annualized returns above 20% over the same 10 year period across market capitalisations. The results tell a very different story. Only 9% of large caps delivered annualized returns above 20%, compared to 22% of mid caps and 25% of small caps (Refer to Fig1). The frequency of high return outcomes rises sharply as company size decreases, highlighting that high return outcomes occur more frequently among mid and small caps than among large caps.
Source of Multibagger Wealth
We wanted to take a closer look at companies with the strongest upside and focus on those that created multibagger wealth. To test this, we analysed companies delivering more than 5x returns over the 10-year period. The results were striking: over 86% of multibaggers originated from mid and small cap companies. These firms benefited from long growth runways, scalable business models, and the ability to reinvest earnings and compound earnings over time. Large caps contributed only a small share to extreme wealth, with multibagger outcomes overwhelmingly concentrated in mid and small caps.
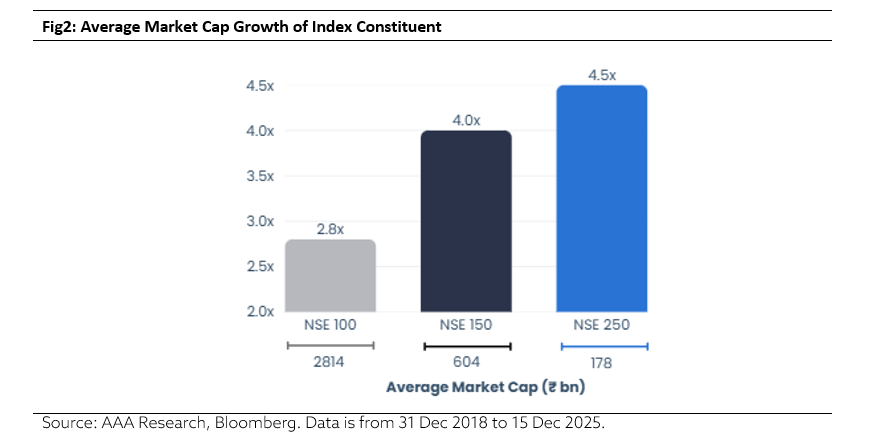
Size Profile of Mid and Small Caps
Mid and small caps are often perceived as fragile because of their smaller size. To assess this, we looked at how market capitalisation has evolved over the past decade. NSE150 mid caps grew 4.0x in average market capitalisation, while NSE250 small caps expanded 4.5x, outpacing the 2.8x growth of NSE100 companies (Refer to Fig2). The average mid cap now stands at ₹60,400 crore, and the average small cap at ₹17,800 crore. In fact, 100% of mid and small caps today have a market cap higher than ₹5,000 crore. This shows that many mid and small caps have grown into far larger and more established businesses than most investors realise. They are no longer fragile and have the scale and strength to navigate through different business cycles.
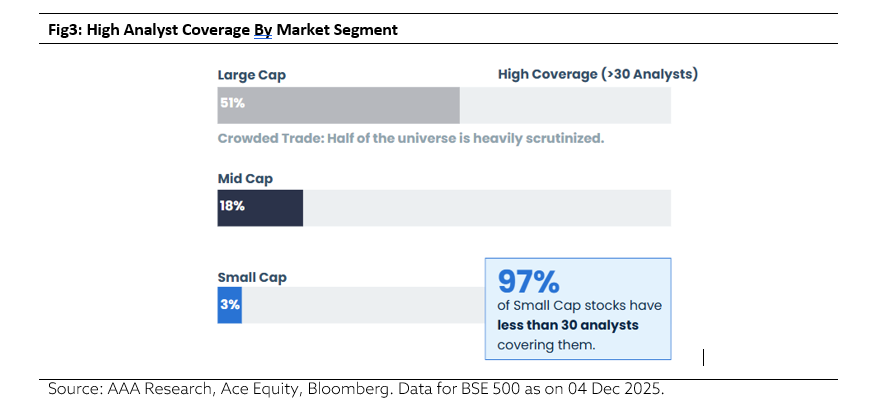
Information Asymmetry Across Market Capitalisations
Research coverage varies significantly across market capitalisations with coverage remaining heavily concentrated in large caps. 97% of small cap companies are covered by fewer than 30 analysts (Refer to Fig3). As a result, a large part of the small cap universe remains under-researched. This creates persistent information gaps, particularly for bottom-up investors seeking to identify high-quality businesses before fundamentals are widely recognised.
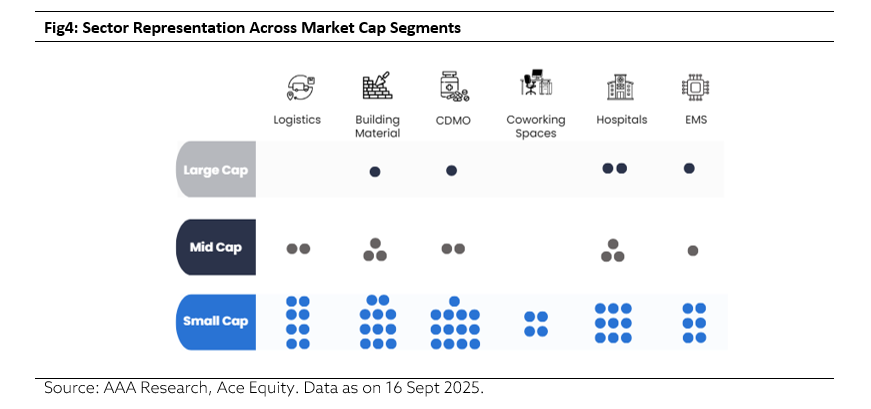
Access to Emerging Growth Segments
Mid and small caps also offer earlier exposure to emerging sectors that are expected to drive the next phase of economic growth. To assess this, we analysed sector representation across market sizes. Sunrise themes are largely absent in large caps, which remain dominated by traditional sectors such as banking, while mid and small caps lead early stage sector participation. For instance, the EMS segment includes seven mid and small cap firms versus just one large cap, while all four listed coworking companies are small caps (Refer to Fig4).
Scalability test
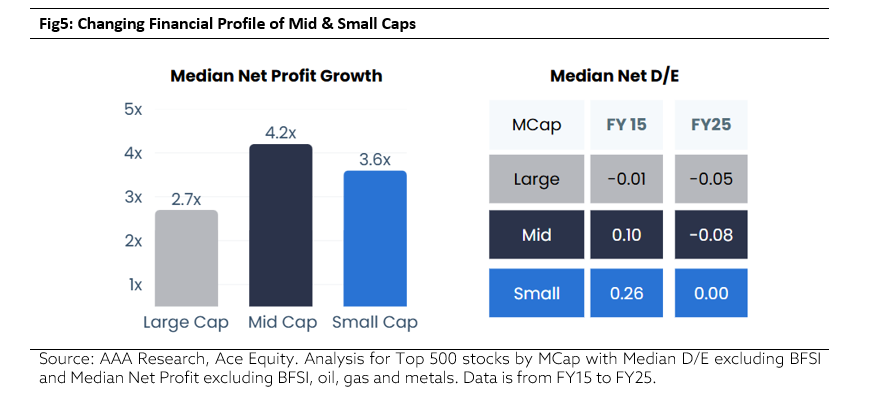
One of the most underrated fundamental criteria is the absolute profit size of a company. Over the last ten years, median net profit grew 4.2x to ₹526 crore for mid caps and 3.6x to ₹150 crore for small caps, compared with 2.7x growth for large caps, indicating meaningful expansion in profit pools (Refer to Fig5). This is particularly important for the Indian economy, which is fragmented: out of ~4,600 listed companies, only ~800 generate profits of ₹100 crore or more. Sustained wealth creation comes not merely from high growth rates, but from businesses that scale profits from sub-scale to systemically relevant levels. That is where market cap migration and long-term compounding truly begin.
Resilience test
Mid and small caps are also often viewed as financially risky, with overleveraged balance sheets and weak financial buffers. To assess this, we examined changes leverage. Over the last ten years, mid caps have moved into net cash territory, while small caps have reduced leverage to near zero (Refer to Fig5). Cleaner balance sheets have strengthened return profiles while meaningfully reducing downside risk across cycles. Financial resilience has improved materially and now compares more closely with large cap. High leverage is no longer the defining trait of mid & small caps. Sustained balance sheet discipline has made this universe more durable and cycle ready.
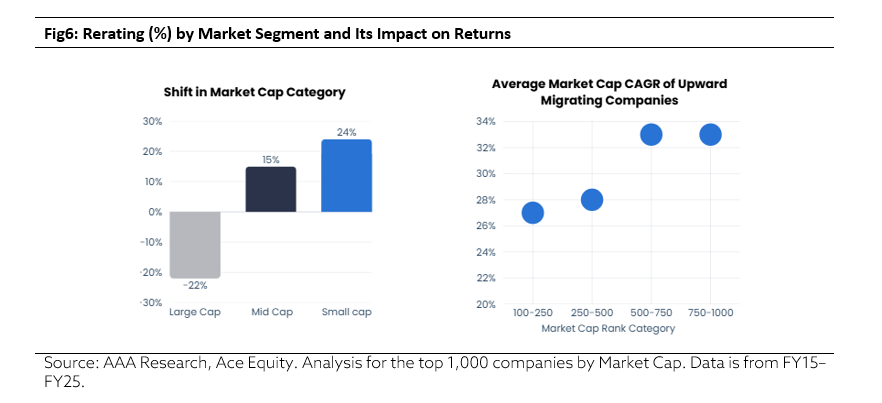
Migration effect
Market leadership is not permanent, as capital continuously migrates across companies and market cap segments. Over time, nearly 22% of large caps drifted down the market cap ladder, while 15% of mid and 24% of small cap companies moved up, translating business progress into re-rating driven wealth creation (Refer to Fig6). Upward mobility is a powerful but underappreciated source of alpha. The probability of moving up the market-cap ladder is highest in mid and small caps. Over the past decade, when mid and small cap companies moved up the market cap ladder, their compounding profile changed meaningfully. Market cap growth accelerated to 25%+ CAGR, driven by the combined effect of sustained earnings growth and valuation re-rating.
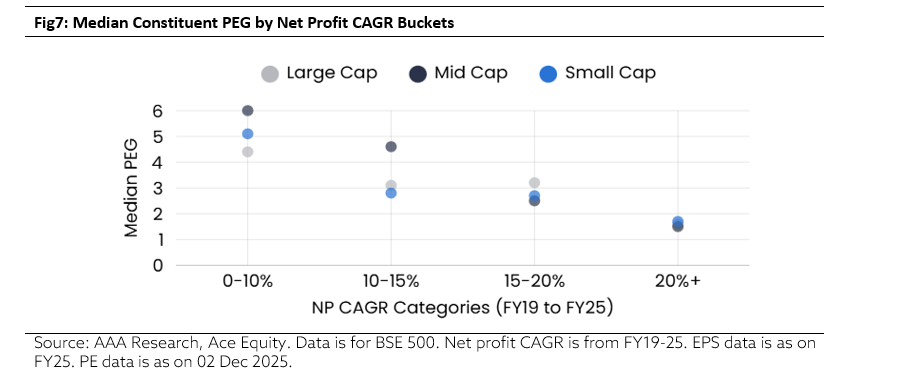
Valuation effect
The most common perception is that mid and small caps are expensive. Even as investors acknowledge their growth and alpha potential, there is often concern that the opportunity is already priced in. Looking at the numbers tells a different story. Companies across market caps delivering >20% net profit CAGR trade at broadly comparable PEG multiples of ~1.5 (Refer to Fig7). Valuations are clustered for companies with similar growth, regardless of size. This shows that attractive opportunities still exist in mid and small caps for those that can sustain their earnings growth momentum.
Conclusion
The fear-driven narrative around mid and small caps, portraying them as fragile, risky, and prone to failure, does not align with the facts. Data on market capitalisation, profit growth, balance sheet strength, and structural sources of alpha show that today’s mid and small caps are far stronger and more resilient than a decade ago. These companies are larger, consistently profitable, and built on scalable business models, giving them the ability to generate long term wealth through earnings compounding and market cap growth. The mid and small caps of today are not the same as they were a decade ago; they are financially resilient, structurally well-positioned, and primed to be the leaders of tomorrow.
Mid and small caps are not misunderstood because they are risky. They are misunderstood because investors are still using an old lens to judge a structurally transformed asset class.
DISCLAIMER: This document is not for public distribution and has been furnished to you solely for your information and may not be reproduced or redistributed to any other person. The manner of circulation and distribution of this document may be restricted by law or regulation in certain countries, including the United States. Persons into whose possession this document may come are required to inform themselves of, and to observe, such restrictions. This material is for the personal information of the authorized recipient, and we are not soliciting any action based upon it. This report is not to be construed as an offer to sell or the solicitation of an offer to buy any security in any jurisdiction where such an offer or solicitation would be illegal. No person associated with AlfAccurate Advisors Pvt Ltd is obligated to call or initiate contact with you for the purposes of elaborating or following up on the information contained in this document. The material is based upon information that we consider reliable, but we do not represent that it is accurate or complete, and it should not be relied upon. Neither AlfAccurate Advisors Pvt Ltd., nor any person connected with it, accepts any liability arising from the use of this document. The recipient of this material should rely on their own investigations and take their own professional advice. Opinions expressed are our current opinions as of the date appearing on this material only. While we endeavour to update on a reasonable basis the information discussed in this material, there may be regulatory, compliance, or other reasons that prevent us from doing so. Prospective investors and others are cautioned that any forward-looking statements are not predictions and may be subject to change without notice. We and our affiliates, officers, directors, and employees worldwide, including persons involved in the preparation or issuance of this material may; (a) from time to time, have long or short positions in, and buy or sell the securities thereof, of company (is) mentioned herein or (b) be engaged in any other transaction involving such securities and earn brokerage or other compensation or act as a market maker in the financial instruments of the company (is) discussed herein or may perform or seek to perform investment banking services for such company(is)or act as advisor or lender / borrower to such company(is) or have other potential conflict of interest with respect to any recommendation and related information and opinions. The same persons may have acted upon the information contained here. No part of this material may be duplicated in any form and/or redistributed without AlfAccurate Advisors Pvt Ltd.’s prior written consent. No part of this document may be distributed in Canada or used by private customers in the United Kingdom. In so far as this report includes current or historical information, it is believed to be reliable, although its accuracy and completeness cannot be guaranteed.